Solar farm inspection is a recurring challenge for asset owners managing thousands of panels across acres of arrays. Traditional O&M workflows combine separate thermal imaging flights and manual ground surveys — thermal drones identify hotspot candidates, then technicians walk rows to verify each one. That split process is slow, expensive, and leaves gaps where defects go undetected between inspection cycles. Videogrammetry — the conversion of continuous drone video into georeferenced 3D maps and orthomosaics — unifies the entire solar panel drone inspection into a single flight, delivering both a visual record and a spatial dataset within minutes of landing.
Key Takeaways
- A single drone flight captures both thermal and RGB video, eliminating the need for separate inspection passes or ground crew follow-up.
- Cloud videogrammetry processing turns a 15-minute solar farm flight into a georeferenced orthomosaic and 3D site model in roughly the same elapsed time — usable the same day.
- Solar O&M teams report direct inspection costs dropping from $1,500–$3,000 per site with traditional thermography contractors to under $40 in processing fees per site using in-house drone operators.
- Accuracy tiers scale from 2–6 inch for site-wide soiling and vegetation surveys up to sub-inch resolution for forensic damage analysis and insurance claims.
- The GeoTIFF orthomosaic output overlays directly onto SCADA performance data and array layout drawings, letting asset managers correlate hotspot locations with underperforming strings in minutes.
Contents
- Why are traditional solar farm inspections slow and costly?
- How does videogrammetry work for solar panel drone inspection?
- What defects can drone video inspection identify?
- How does drone inspection data integrate with SCADA and asset management?
- How does solar inspection data support warranty and insurance claims?
- FAQ
Why are traditional solar farm inspections slow and costly?
Traditional solar farm inspection separates data collection into two sequential workflows: a thermal drone flight to flag hotspot candidates, followed by manual ground surveys to verify each flagged module. That two-step process doubles mobilization costs, stretches inspection timelines over multiple days, and often misses defects in panel areas that ground crews cannot safely or efficiently reach. For utility-scale sites of 10 MW or more, a single inspection cycle using specialized thermography contractors typically costs $1,500–$3,000 per site, before accounting for travel and scheduling delays.
The National Renewable Energy Laboratory's solar O&M best practices guidance notes that undetected module-level failures — including bypass diode failures, cell cracks, and hotspot progression — compound over time, reducing annual energy yield and accelerating degradation beyond design parameters. The longer the gap between inspection cycles, the more production revenue is lost before corrective maintenance begins.
For portfolio operators managing multiple sites across a region, thermography contractors with calibrated equipment have limited regional availability. Mobilization costs stack regardless of how many defects a site turns out to have. The result is that many asset owners inspect sites annually when quarterly inspection would meaningfully improve uptime.
Drone video mapping changes the unit economics by enabling in-house O&M technicians to run full-site inspections with equipment they already operate for other tasks, uploading footage to a cloud platform and receiving actionable spatial data without specialized thermography expertise on site.
How does videogrammetry work for solar panel drone inspection?
Videogrammetry converts continuous drone video — including thermal video from dual-sensor payloads — into georeferenced 3D models and orthomosaic maps. Rather than capturing individual photos triggered at set intervals, the drone records uninterrupted video as it flies an automated grid pattern over the array. The cloud platform extracts frames, matches overlapping geometry between them, and reconstructs the scene as both a 2D top-down orthomosaic and a navigable 3D model, with GPS coordinates embedded throughout.
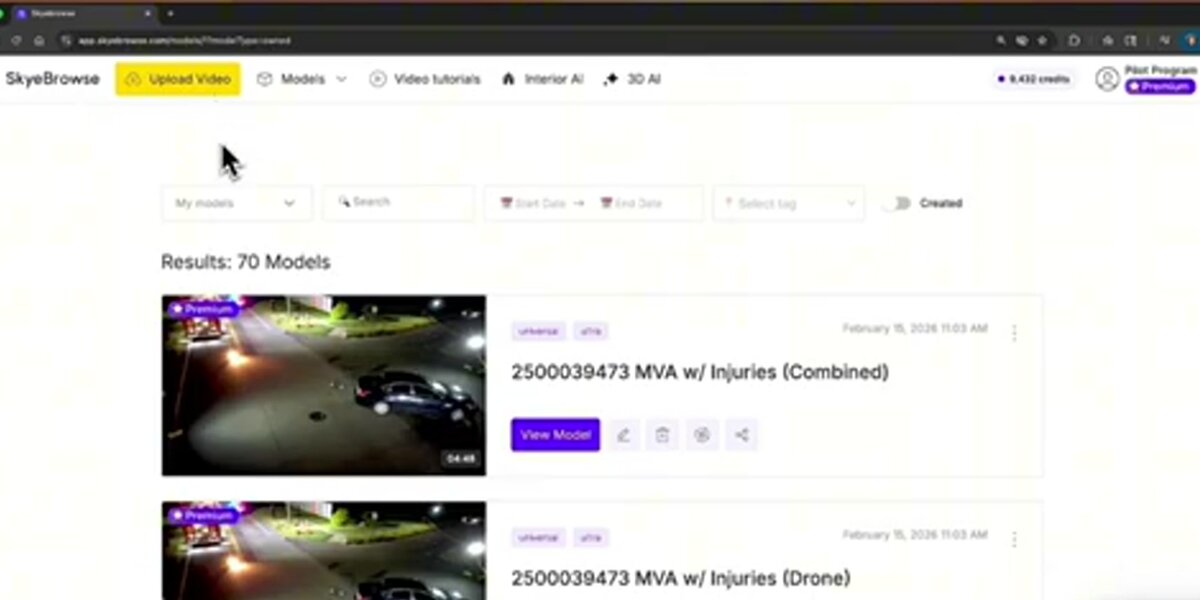
The workflow on SkyeBrowse begins at app.skyebrowse.com. After landing, the operator uploads the flight video along with the GPS telemetry log — a .SRT file from DJI drones, or .ASS from Autel — which the platform uses for improved georeferencing accuracy. Processing runs on cloud infrastructure at roughly a 1:1 time ratio relative to flight duration. A 15-minute grid flight over a 2 MW solar array returns a processed orthomosaic and 3D model in approximately 15 minutes. No desktop hardware or specialized software installation is required.
For an overview of how different drone mapping approaches compare, see our guide on drone inspection services and the drone 3D mapping workflow. The key difference from traditional photogrammetry — which stitches individual photos taken at fixed intervals — is that continuous video provides consistent frame overlap regardless of wind, speed variation, or flight path irregularities, reducing data gaps over large uniform surfaces like solar panel arrays.
What defects can drone video inspection identify?
Solar panel drone inspection using videogrammetry can identify hotspots, soiling patterns, cracked cells, delamination, bypass diode failures, vegetation encroachment, and mechanical damage from weather events. The specific defects detectable depend on sensor type — RGB video captures visual anomalies while thermal video identifies thermal irregularities — and on the processing resolution tier selected for the inspection.
For site-wide surveys where the primary concerns are soiling accumulation and vegetation encroachment, the Lite processing tier delivers 2–6 inch relative accuracy. That resolution clearly shows overgrown perimeter zones, heavy soiling concentrations across panel rows, and panel sections with obvious physical damage — all information sufficient to prioritize cleaning crews and maintenance dispatches without panel-level precision.
For panel-level defect classification, the Premium tier at 8K resolution achieves approximately 0.25 inch accuracy. At this detail, bypass diode failures, isolated cell cracks, and early-stage delamination are distinguishable in the orthomosaic. The output format — a GeoTIFF orthomosaic — supports georeferenced annotation, meaning each flagged defect carries GPS coordinates that field technicians can navigate to directly without searching rows manually.
When catastrophic events require forensic-grade documentation — hail impact damage, fire damage, or manufacturing defect analysis for litigation — Premium Advanced processing at 16K resolution provides sub-inch detail sufficient for damage quantification reports and insurance claim support. This tier also applies AI-based moving object removal, eliminating artifacts from vehicles or equipment present during flight. For context on how resolution differences affect inspection outputs, our orthomosaic vs 3D model guide explains when each output format best serves inspection workflows.
The FAA's commercial drone operations guidance outlines operator certification and airspace authorization requirements that apply to solar site inspection flights, including Part 107 remote pilot certification that most in-house O&M drone programs already maintain.
How does drone inspection data integrate with SCADA and asset management?
The GeoTIFF orthomosaic output from a drone solar inspection carries embedded GPS coordinates that align directly with SCADA monitoring zones and array layout drawings. Asset managers overlay the thermal or visual orthomosaic onto their performance monitoring dashboards, correlating hotspot locations with underperforming strings to prioritize repairs by revenue impact rather than by inspection order.
SCADA systems show which strings or inverters are underperforming but rarely reveal the cause without physical investigation. When SCADA flags unexpected production loss from a specific combiner zone, a targeted drone flight over that section of the array can pinpoint failed modules, loose connections, or shading sources within the same day — compared to sending technicians to test individual modules across acres of panels.
The LAZ point cloud export integrates with solar design tools including PVsyst and Helioscope. Engineers use it to quantify shading from vegetation growth since commissioning, calculate row-to-row interference as a site ages, and validate as-built installation geometry against original design specifications — critical for resolving performance guarantee disputes.
Multi-year inspection archives enable quantitative degradation tracking. Quarterly models captured at consistent flight settings can be compared sequentially to measure soiling accumulation rates, track hotspot progression, and validate whether cleaning or repair interventions produced expected performance recovery. Our drone mapping software guide covers how cloud-based platforms store and organize model archives for ongoing monitoring programs.
How does solar inspection data support warranty and insurance claims?
Georeferenced drone inspection records — orthomosaics with GPS-tagged defect locations, timestamped 3D models, and thermal overlays correlated with SCADA performance data — provide asset owners with verifiable, spatial evidence for warranty and insurance claims. Manufacturers and insurers can assess documented defects remotely rather than requiring on-site visits, which accelerates claim review timelines and reduces the ambiguity that leads to disputes.
Module warranties typically span 10–25 years. Archived sequential inspection models provide time-indexed evidence of defect onset and progression, with GPS-referenced locations that cross-reference against manufacturing lot numbers and installation dates. Cloud-hosted storage with long-term retention keeps those archives accessible years after commissioning.
For insurance claims following storm or hail damage, rapid post-event drone inspection documents the full extent of damage before repair crews begin work — establishing pre-repair condition for loss valuation. A timestamped site model produced within hours prevents disputes over pre-existing versus storm-caused damage. Our utility infrastructure inspections guide covers similar post-event documentation workflows for transmission and distribution assets.
Controlled sharing via shareable model links lets O&M teams, engineering consultants, and insurance adjusters access the same spatial dataset without large file transfers. Access logs create an audit trail that supports evidentiary chain-of-custody requirements for warranty disputes and litigation.
FAQ
What type of drone is best for solar farm inspection?
Any GPS-enabled drone with a thermal or RGB camera works for solar farm inspection. Popular choices include the DJI Mavic 3 Thermal, DJI Matrice 350 RTK with dual-sensor payloads, and the Autel Evo II Dual for combined thermal and visual capture in a single flight. SkyeBrowse accepts video from all of these platforms — see the full supported drones list for compatibility details.
How accurate is drone photogrammetry for solar panel inspection?
Accuracy depends on processing tier and flight altitude. At Premium (8K) processing, relative accuracy reaches approximately 0.25 inch — sufficient for panel-level defect classification. For site-wide soiling and vegetation surveys where panel-level precision is not required, Lite processing delivers 2–6 inch relative accuracy at faster turnaround. For forensic damage analysis, Premium Advanced (16K) achieves sub-inch detail.
Can drone video replace thermal imaging for solar inspections?
Drone-based thermal video does not replace thermal imaging — it is thermal imaging, captured during flight and converted into georeferenced thermal orthomosaics. A drone with a thermal camera flying a grid pattern over a solar array produces the same hotspot identification as a traditional thermal inspection, while also generating a 3D site model and a visual record in the same pass.
How long does it take to process a solar farm drone inspection?
SkyeBrowse's cloud platform processes footage at roughly a 1:1 ratio relative to flight duration. A 15-minute flight over a solar array typically returns a processed orthomosaic and 3D model within about 15 minutes of upload. That same-day turnaround lets O&M managers review findings and dispatch repair crews without waiting for overnight or multi-day processing cycles.